Post-Graduation Employment Data
2021-2022 MPA Post-Graduation Employment Data
179 MPA students earned MPA degrees at the end of spring 2022. A survey from that graduating cohort produced 165 responses (92% response rate). Below, is the summary of the post-graduation employment data:

2020-2021 MPA Post-Graduation Employment Data
212 of our students earned MPA degrees at the end of spring 2021. A survey from that graduating cohort produced 190 responses (90% response rate). Below, is the breakdown of our post-graduation employment data:
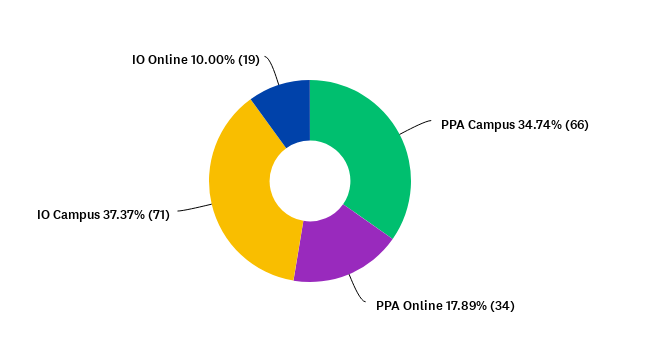
Program Modality
2019-2020 MPA Post-Graduation Employment Data
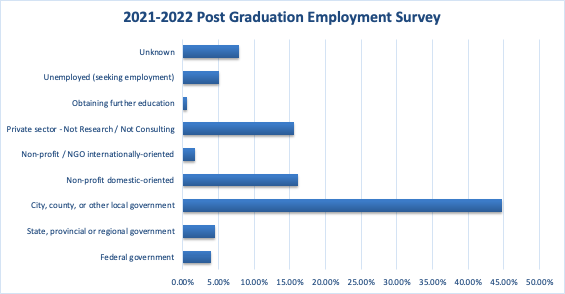
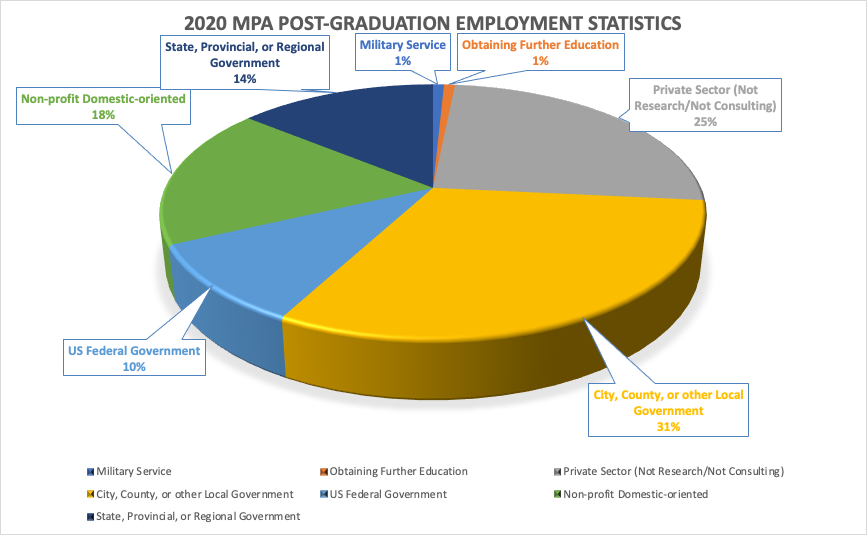
166 of our students earned MPA degrees at the end of spring 2020. A survey from that graduating cohort produced 145 responses (87% response rate). 88% of our 2020 graduates are employed. The breakdown for those employed graduates are below:
31% in city, county, or other local government
25% in the private sector (not research/not consulting)
18% in non-profit domestic-oriented organizations
14% in state, provincial, or regional government
10% in United States federal government
1% in military service
1% obtaining further education

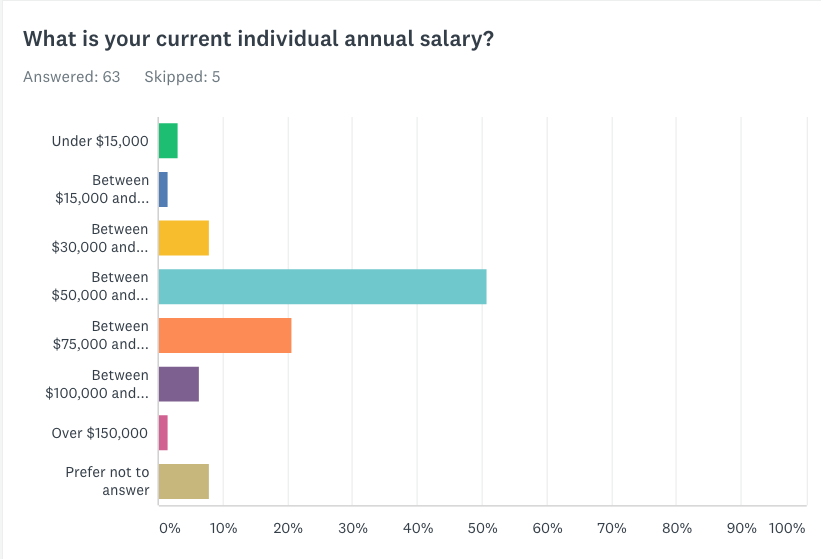
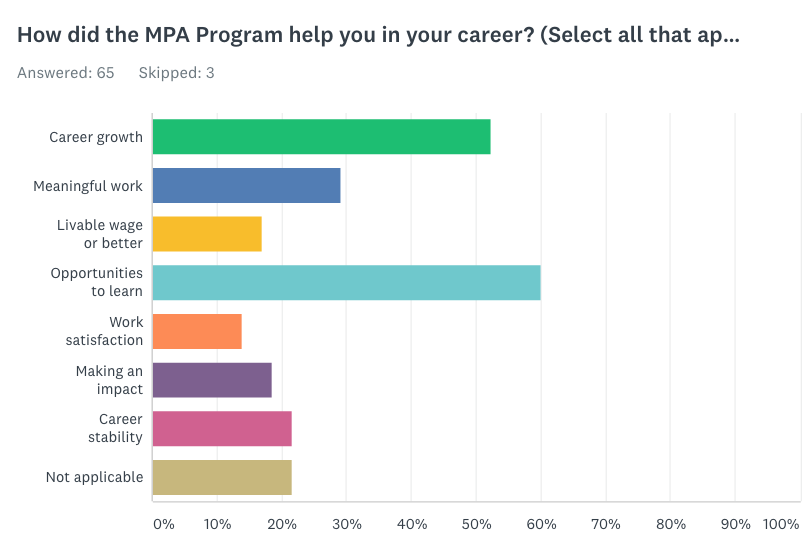
Based on our 2019-2020 post-graduation employment survey, our recent graduates provided information about their individual annual salary and how the MPA Program benefited them in their careers.
The MPA Programs conducted a post-employment survey on our 2020 MPA graduates. 166 of our students received MPA degrees during the spring and summer 2020 semesters. A survey from the graduating cohort produced 145 responses from that group (87% response rate). Thus, there were 21 unknown placements. Of those who have responded to the survey, 92% of the graduates are employed or not seeking employment if unemployed.
| 2020 MPA Post-Employment Statistics | ||||
| MPA-PPA Campus | MPA PPA Online | MPA IO Campus | MPA IO Online | |
| National or central government in the same country as the program | 7 | 2 | 3 | 1 |
| State, provincial or regional government in the same country as the program | 9 | 3 | 5 | 1 |
| City, County, or other local government in the same country as the program | 24 | 7 | 8 | 1 |
| Foreign government (all levels) or international quasi-governmental | 0 | 0 | 0 | 0 |
| Nonprofit domestic-oriented | 13 | 2 | 6 | 2 |
| Nonprofit/NGOs internationally-oriented | 0 | 0 | 0 | 0 |
| Private Sector – Research/Consulting | 0 | 0 | 0 | 0 |
| Private Sector but not research/ consulting | 4 | 6 | 17 | 5 |
| Military Service | 0 | 0 | 1 | 0 |
| Obtaining further education | 0 | 0 | 1 | 0 |
| Unemployed seeking employment | 6 | 0 | 5 | 1 |
| Unemployed not seeking employment | 2 | 0 | 3 | 0 |
| Total Number of Graduates | 65 | 20 | 49 | 11 |